Experimentation
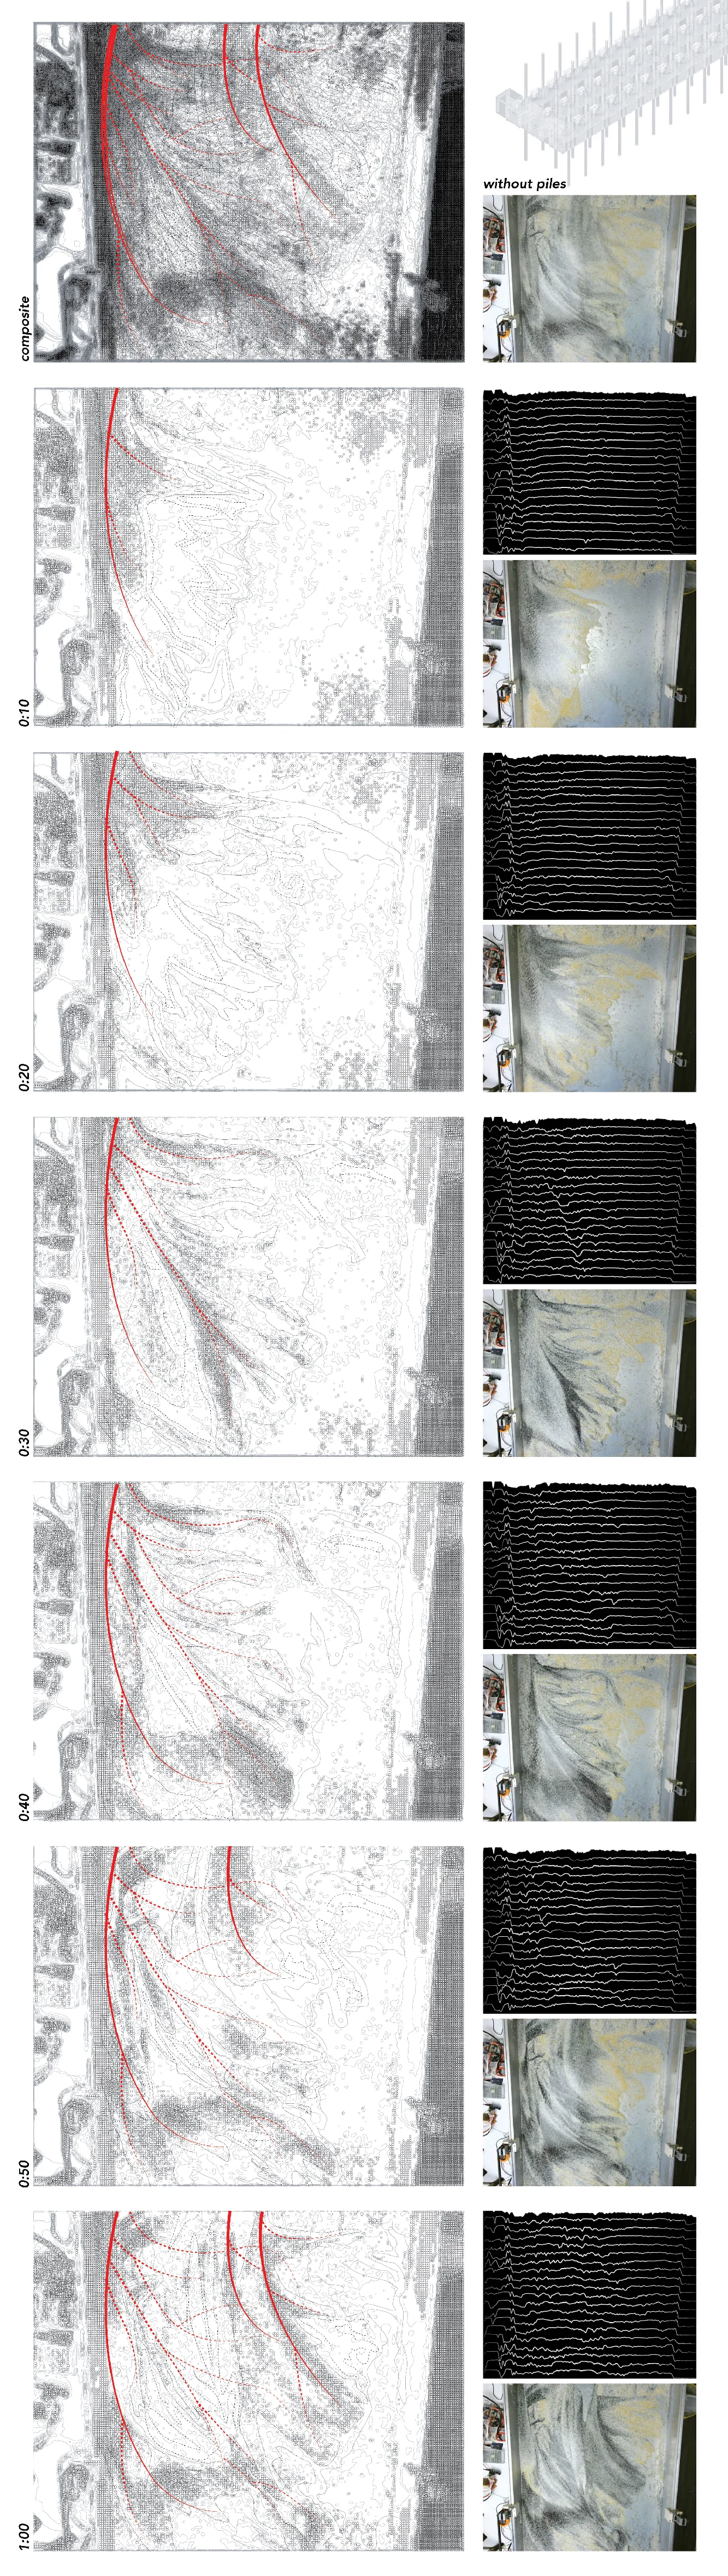
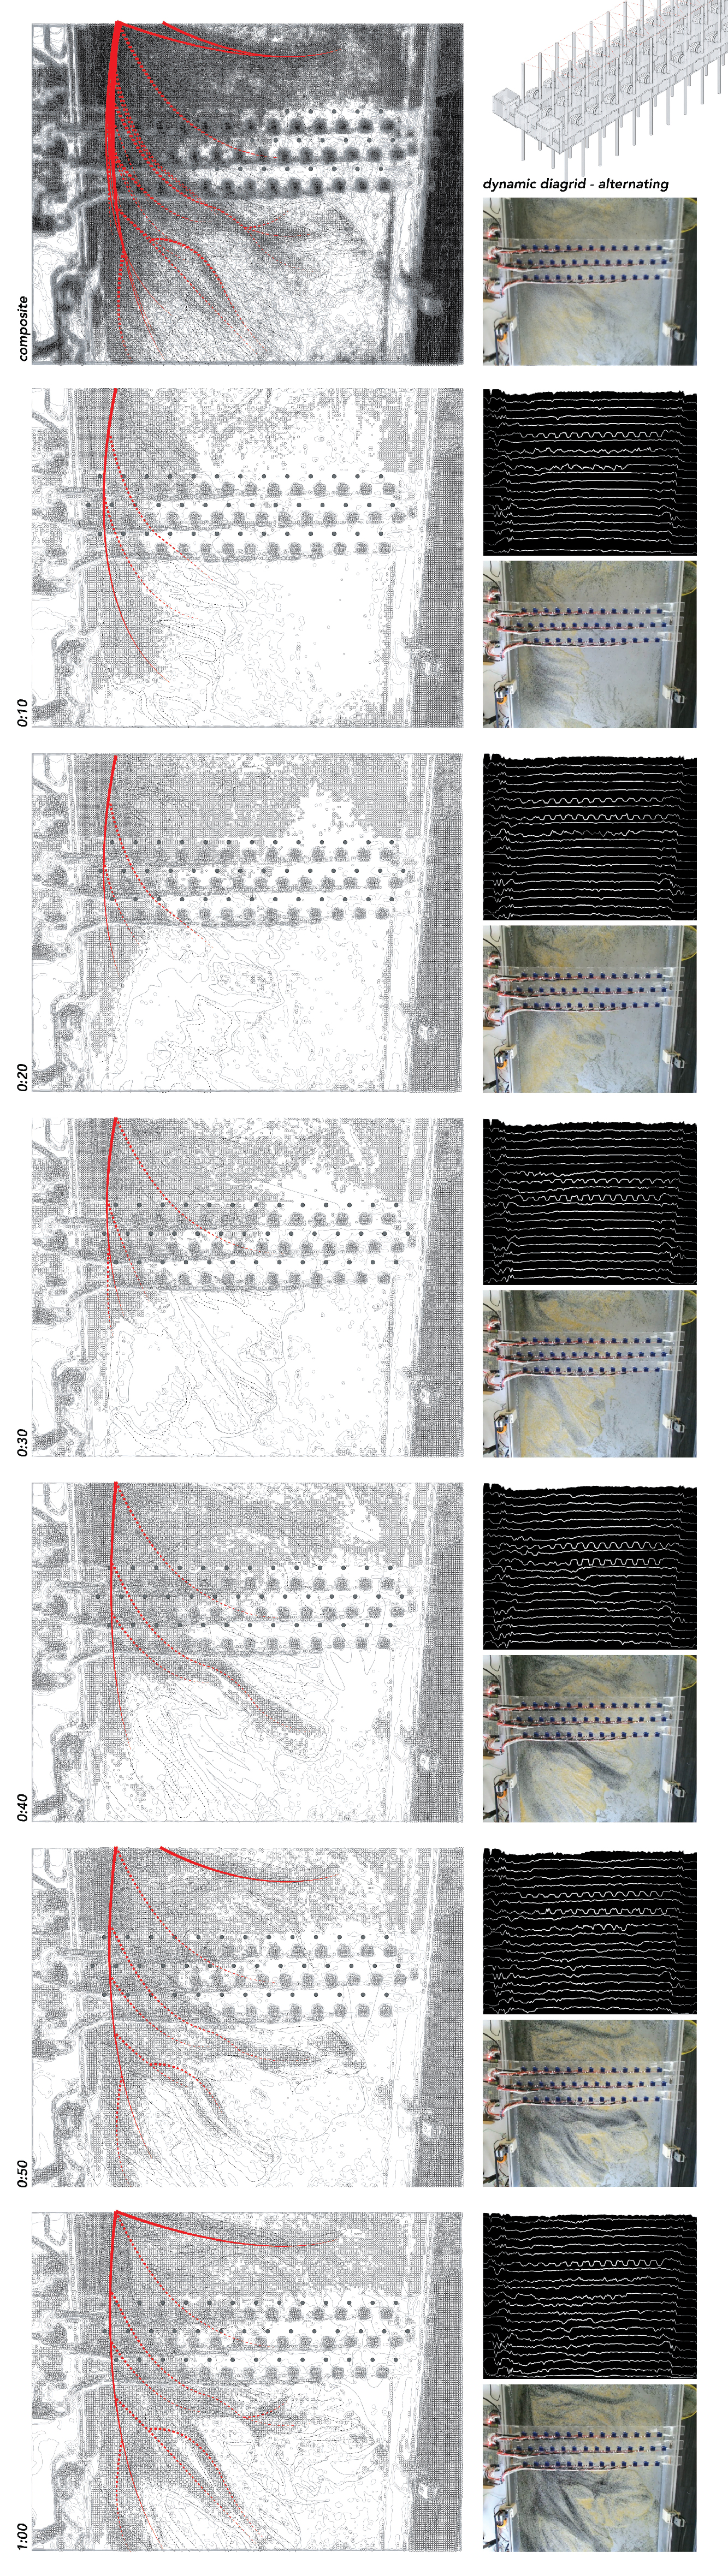
The following are recorded real-time experiments of different pile-configuration, scanned over the duration of 1-hour for each scenario where the topographic change and sediment accumulation are recorded as vector drawings of contour lines, and varying radii of circles, respectively.


Previous: Prototyping | Next: Proposal